How to interpret the radar
What each of the eight signals measures, how the verdict is decided and what to do when one is low.
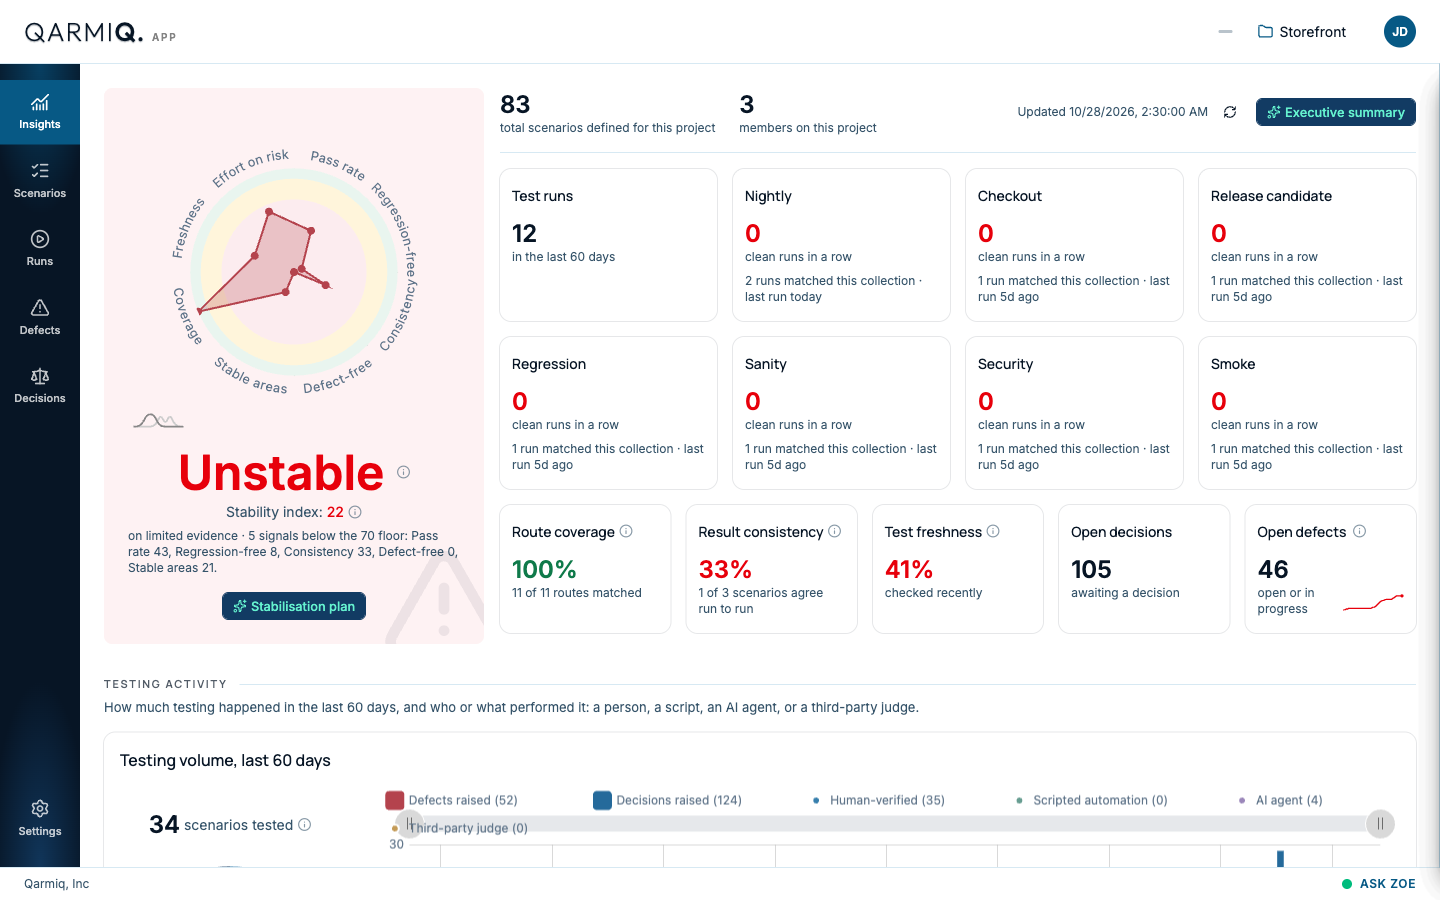
The radar scores eight signals from 0 to 100. Five say whether the product is behaving. Three say how much that reading can be trusted. The outer ring is 100, and a project is held to reaching it on all eight.
Reading the shape
Each spoke is one signal, and the needle point shows its score. The background has three bands:
| Band | Score | Meaning |
|---|---|---|
| Green | 90 to 100 | Healthy. |
| Amber | 70 to 89 | Needs attention. |
| Red | Below 70 | Below the floor. |
A shape that fills the outer ring is a stable, well-tested project. A shape pulled in on one side shows where to look first. Hover a point for the signal’s exact score and what drove it.
The five stability signals
These decide the verdict.
| Signal | What it measures | What raises it |
|---|---|---|
| Pass rate | The share of scenario verdicts in the last 60 days that passed. Failed, blocked, skipped and inconclusive all count against it. | Fix failing scenarios and finish blocked ones. Run what has not been run. |
| Regression-free | Days since a scenario last went from passing to failing, against the 60-day window. No regression ever scores 100. A regression today scores 0. | Time without regressions. Fix a regression and keep it fixed. |
| Consistency | Of the scenarios tested more than once in the same browser and environment, the share that gave the same result both times, allowing up to 20% disagreement. | Remove flakiness: unstable data, timing, shared state. |
| Defect-free | 100 minus 20 for each open critical defect and 10 for each open major one. | Close critical and major defects. |
| Stable areas | The share of product areas that are stable. An area with no verdicts in the window counts as stale, not stable. | Test every area regularly, and fix failing ones. |
The three confidence signals
These never change the verdict word. They say how far to trust it.
| Signal | What it measures | What raises it |
|---|---|---|
| Coverage | The share of mapped routes with at least one scenario. | Crawl your environments, then write scenarios for uncovered routes. |
| Freshness | The share of scenarios tested in the last 30 days. | Run scenarios on a regular rhythm. |
| Effort on risk | How well testing effort matches where the risk is. 100 means effort is spread in proportion to risk. | Test the risky, under-tested areas. See Areas and automation. |
How the verdict is decided
The verdict looks only at the five stability signals, using the 70 floor. It is not an average.
- Unstable: Pass rate or Defect-free is below 70 (either one is enough), or any two stability signals are below 70.
- Watch: exactly one other signal is below 70, or two or more signals are in the amber band.
- Stable: everything else. One amber signal still reads Stable, with a note naming it.
Not yet assessable is shown when there are no verdicts in the last 60 days. Nothing else is checked until there are.
Evidence
The confidence signals set the evidence level that appears with the verdict:
- strong evidence: all three confidence signals are green.
- limited evidence: at least one is not green.
A project can be Stable on limited evidence, for example a passing product with no pages mapped. It is never marked Unstable for that alone.
The stability index
The Stability index is one number for following the trend. It weights the five stability signals: Pass rate 30, Defect-free 25, Regression-free 20, Consistency 15 and Stable areas 10. The two core signals carry more than half. Use the verdict to decide whether to act and the index to see whether you are improving.
What to do next
Open the Stabilisation plan. It turns the low signals into ordered steps.
Last verified against the product on 28 October 2026.